
A response to the Gotham City Research short report
Introduction
The Gotham City Research report, dated July 24, 2025, titled „The Truth about TPL, Horizon, and the Asset/Liability Mismatch,“ asserts that Texas Pacific Land Corporation (TPL) is significantly overvalued, projecting a 53%-61% stock price downside from ~$932 to $361-$440 per share. The report claims TPL’s stock price surge since 2019 is driven by price-insensitive buying due to its 2021 corporate reorganization and S&P 500 inclusion, a misperception that Horizon Kinetics is buying shares when they are selling, a declining business quality transitioning to a capital-intensive model, and characteristics akin to penny stock pump-and-dump schemes. We have identified four specific deficiencies in the report:
- Failure to recognize the cyclicality of TPL’s P/E ratio from 2001 to 2024, particularly when reliant on oil and gas royalties.
- Omission of the potential for TPL’s water business to capitalize on data center demand.
- Lack of evidence that Horizon Kinetics’ activist campaign caused long-term damage to shareholder value.
- Failure to acknowledge that water usage in the oil and gas industry is tied to well operation volumes, not commodity prices, ensuring stable demand even during low-price periods.
This survey note provides an rebuttal to these points and other key report claims, leveraging data from TPL’s SEC filings, market analyses, industry reports, and peer comparisons as of July 28, 2025. Each counterargument is structured with granular analysis, historical and industry context, and forward-looking projections to demonstrate that TPL’s valuation and business prospects are stronger than the report suggests.
Counterarguments to Key Report Claims
1. Cyclicality of P/E Ratio
Report Claim: TPL’s stock price increased 4.2x from 2019 to 2024 ($260 to $1,040, adjusted for splits), while EPS grew only 1.4x, indicating overvaluation detached from fundamentals (Pages 5, 7, 20).
Counterargument: The report’s assertion of overvaluation ignores the historical cyclicality of TPL’s price-to-earnings (P/E) ratio, which has fluctuated significantly due to its historical reliance on oil and gas royalties. The report’s focus on the 2019-2024 period isolates a snapshot that misrepresents TPL’s valuation dynamics, particularly as it transitioned to a diversified business model with water royalties and services. Historical P/E data illustrates this cyclicality:
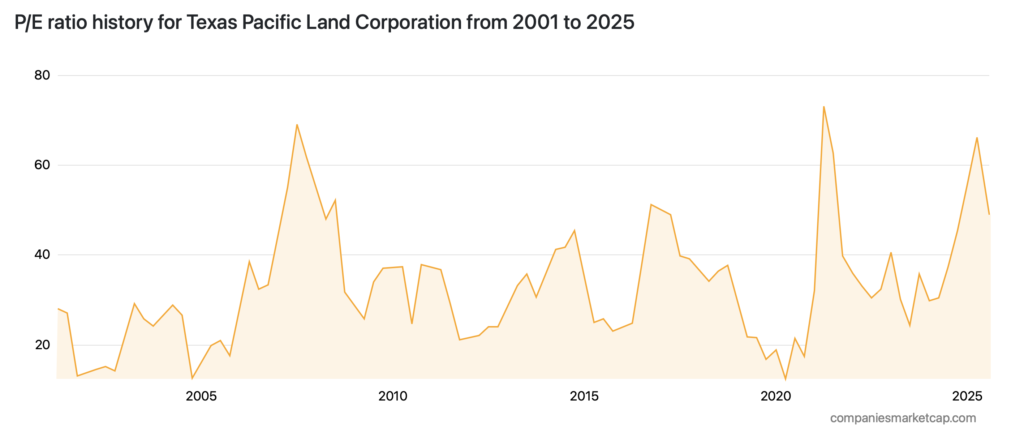
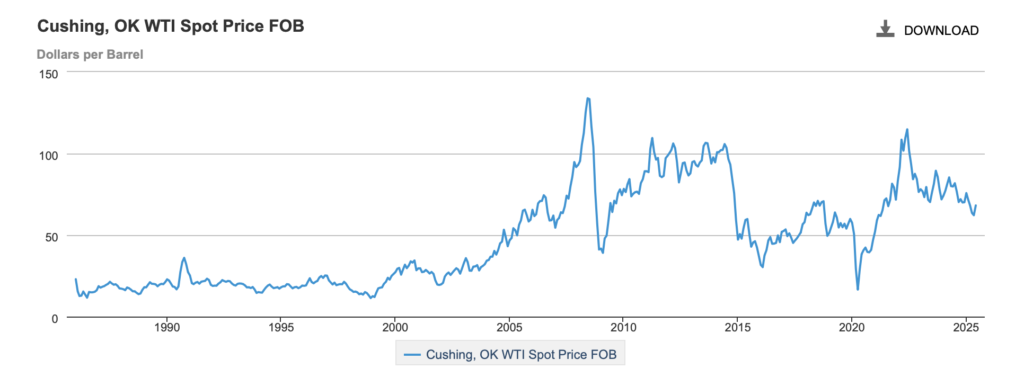
- Cyclical Patterns: The P/E ratio’s fluctuations correlate with oil price cycles, as TPL’s revenue was historically dominated by oil and gas royalties. Low P/E ratios (e.g., 13 in 2001 or 25-12.4 in 2019-2020) coincided with low oil prices, while peaks (e.g., 69 in 2007 or 73 in 2021) reflected highs. The 2024 P/E of 55.94 is within historical ranges and aligns with expectations of growth from water royalties and a general improvement of the business. The report’s claim of a “divergence” ignores this context, assuming a static P/E norm.
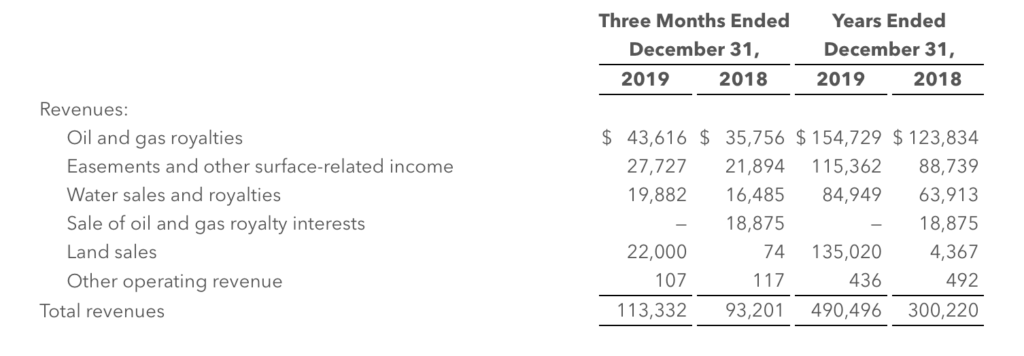
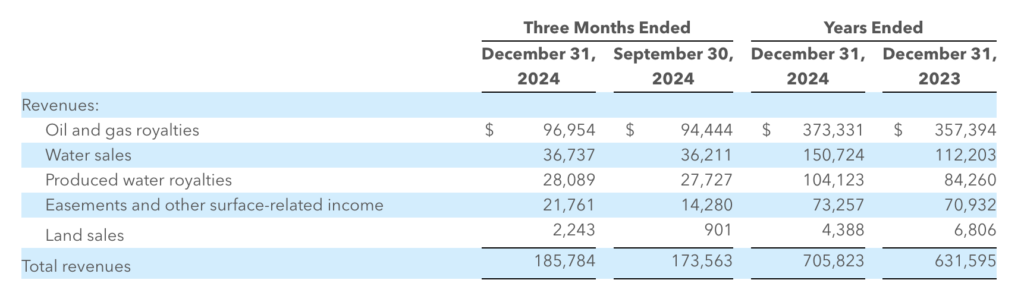
- Strategic Diversification: From 2019 to 2024, TPL has further diversified into water sales, royalties, and servicing, reducing reliance on oil and gas royalties. The 2024 10-K shows a combined $254.8M in water-related revenues, up 200% from $84.9M in 2019. Oil and gas revenues grew from $154.7M in 2019 to $373,3M in 2024, an increase of about 150%. This shift towards water-related revenues (more under „2. Water Infrastructure and Data Center Opportunities“) supports a higher P/E, as these revenue are less cyclical, making the business more consistent.
- Peer Comparison: Royalty peers like Viper Energy Partners (VNOM) and Black Stone Minerals (BSM) exhibit similar P/E volatility, with Viper’s P/E ranging from 12 to 50 (2019-2024). TPL’s 50-60x P/E aligns with sector norms for high-margin firms during growth phases. Due to its well diversified business model (oil-, gas-, water- and surface-related revenues) TPL is in a unique position in terms of consistency and future growth opportunities compared to its peers.
- The report might argue that a 55.94 P/E is unsustainable given 1% EPS growth (2022-2024 Page 8). However, this ignores forward-looking estimates, the market’s pricing of diversified high margin revenue streams, clean balance sheet and unique assets. While stocks are valued based on the future, the report uses past and current performance and lackluster estimates of „experts“ to argue that TPL is overvalued. Additionally the timeframe of choice is misleading as the Autors picked the top of an oil boom to compare to the current downturn. While oil and gas revenues decreased from $452M to §373M water-related revenues increased from $156M to $254M which not only demonstrates their importance related to oil and gas cyclicality but also its general growth potential,
2. Water Infrastructure and Data Center Opportunities
Report Claim: TPL’s business quality is declining, with slower revenue (3% CAGR) and EPS (1% CAGR) growth from 2022-2024, and its water business is tied to cyclical oil and gas activities, not immune to downturns (Pages 20-23).
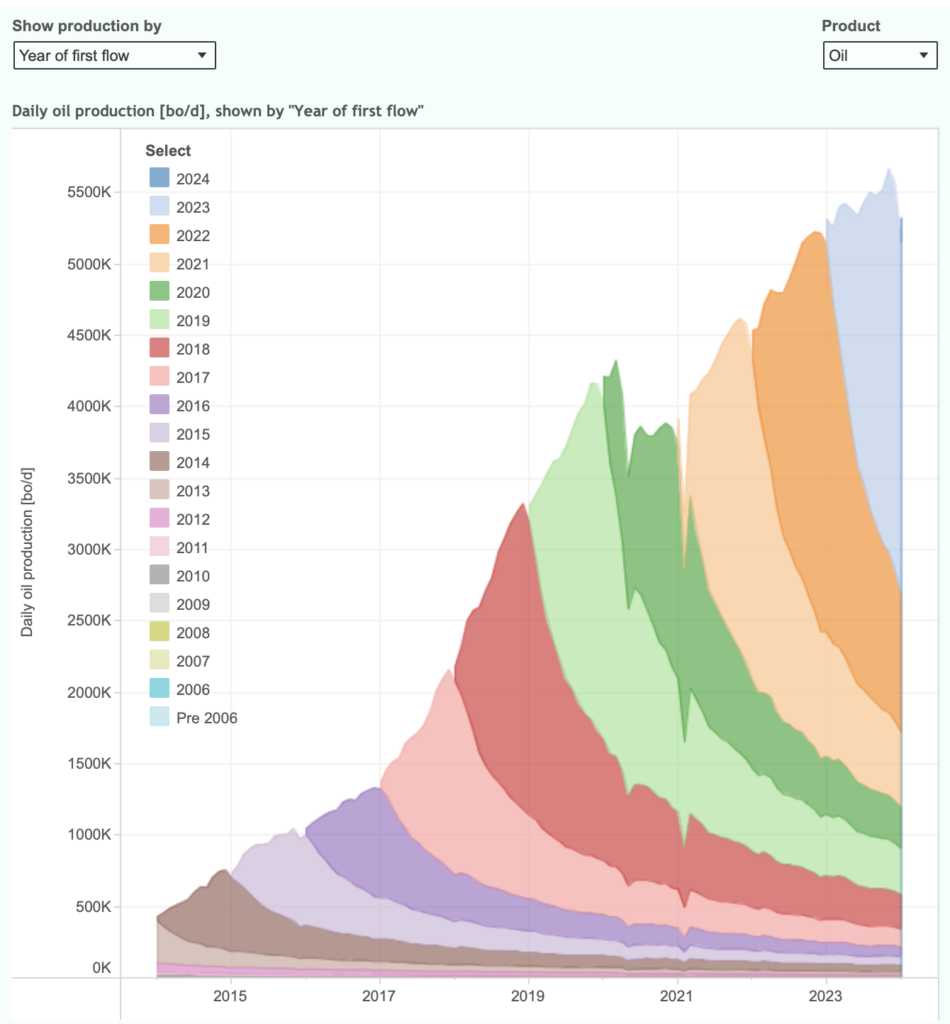
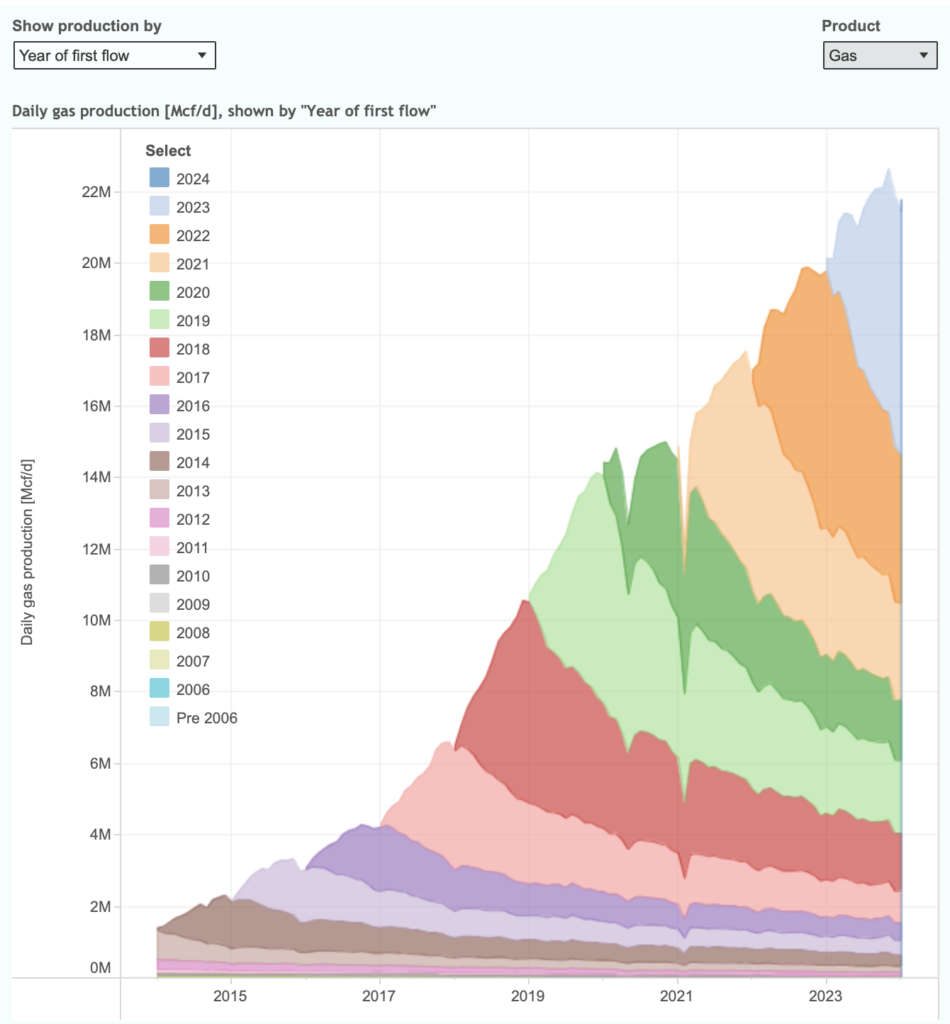
Counterargument: The report significantly underestimates TPL’s water business potential, particularly its ability to capitalize on surging data center demand in the Permian Basin. Data centers require 1-5 million gallons of water daily for cooling, and the Permian, where TPL owns 873,136 surface acres, is emerging as a data center hub due to its energy resources and land availability. TPL’s water sales, royalties, and servicing segments are uniquely positioned to meet this demand, providing a continuous and reliable growth driver that counters the report’s claim of declining quality and cyclical vulnerability. The authors again fail to understand the business of TPL, as the slowdown in revenue and EPS growth is not tied to a decline in operational quality but rather a slowdown in oil and gas production growth while the commodity prices trended downward.
Detailed Analysis:
- Revenue Potential: TPL’s 2024 10-K reports a combined $254.8M. A single data center using 1M gallons daily (low estimate on 1-5M gallons per day) at $0.10/gallon (WaterWorld industry estimate) could generate $36.5M annually on water sales alone, marking double digit growth based on current revenues. With 3-5 data centers projected in the Permian by 2030 (CBRE 2025 Data Center Market Outlook, 20% CAGR), TPL’s data center related water sales revenue could reach $100M-$200M annually.
- Strategic Advantage: TPL’s 873,136 acres provide unmatched scale for water infrastructure (e.g., pipelines, treatment facilities). Competitors like ARIS (276 employees, Page 22) and NGL (569 employees, Page 22) lack TPL’s land integration and scale. TPL is the only player in the permian with vast resources in surface acres, royalty acres and water assets, additionally TPL is run extremely efficiently with a minimal headcount. Comparing ARIS or NGL to TPL only underlines that the authors fail to understand it’s business and assets, none of them (VNOM, ARIS, NGL) come close to the operating prowess of TPL which is reflected in their historic underperformance.
- Revenue Diversification: Venturing into the water business opened the door for more revenues unrelated to the energy sector, underling its adaptability which enabled great returns in the past. Arguing that diversifying the business model to deliver more constant and growing cashflows seems delusional.
- The report might argue that data center demand is speculative and unproven for TPL. However, TPL’s 2024 10-K, CBRE’s 2025 outlook, and Data Center Dynamics confirm water demand growth. The report’s omission of this opportunity distorts TPL’s growth trajectory.
3. Water Usage Tied to Well Operation Volumes
Report Claim: TPL’s water business is subject to the same cyclicality as oil and gas royalties, implying vulnerability to commodity price declines.
Counterargument: The report fails to recognize that water usage in the oil and gas industry is primarily driven by well operation volumes, not commodity prices, ensuring stable demand even during low-price periods (as laid out in previous point). Hydraulic fracturing and produced water management require consistent water volumes for existing wells, as operators like ExxonMobil and Chevron maintain production to meet contractual obligations and cash flow needs, regardless of price fluctuations. TPL’s water sales and servicing segments benefit from this resilience, countering the report’s claim of cyclical vulnerability and supporting its business quality.
Detailed Analysis:
- Water Demand Dynamics: Hydraulic fracturing uses 10-20 million gallons per well (USGS, July 28, 2025), and produced water management (handling wastewater) is ongoing for operational wells. The Permian Basin has ~50,000 active wells (EIA, 2025), each requiring 100,000-500,000 gallons annually for maintenance, even during low oil prices (e.g., $40/barrel in 2020).
- Resilience to Price Cycles: Historical data shows water revenue growth from $156M in 2022 to $254M in 2024, despite WTI oil prices falling from an average of $95 (2022) to $81 (2024). This reflects volume-driven demand, as operators prioritize existing production. For example, Chevron’s 2024 Permian output remained at 1M barrels/day (Chevron 10-K), requiring consistent water for fracturing and wastewater handling.
- Comparison to Oil Royalties: Unlike oil royalties, which fluctuate directly with prices, water revenue depends on well activity. Even in low-price environments (e.g., 2020), Permian production fell only 10% (EIA), as operators maintained existing wells, ensuring water demand. TPL with advanced treatment facilities, captures this steady demand.
- Synergy with Data Centers: The water business’s resilience complements its data center potential (Point 2). Both are non-commodity-linked, diversifying TPL’s revenue and supporting a premium valuation. The report’s conflation of water with oil cyclicality misrepresents existing business data.
- The report might argue that low prices reduce new well drilling, impacting water demand. While new wells (10-15% of annual Permian activity, EIA) use more water, existing wells dominate demand, ensuring stability. TPL’s 2024 water revenue growth confirms this resilience.
Evidence: TPL’s 2024 10-K, EIA’s Permian well data, and Chevron’s 2024 10-K validate stable water demand. The report’s cyclicality claim overstates risks.
4. Horizon Kinetics’ Activist Campaign
Report Claim: Horizon Kinetics’ 2019-2021 activist campaign to convert TPL from a trust to a corporation was an “exit plan” to facilitate selling, and their net selling despite a perception of buying risks a stock decline (Pages 13-16).
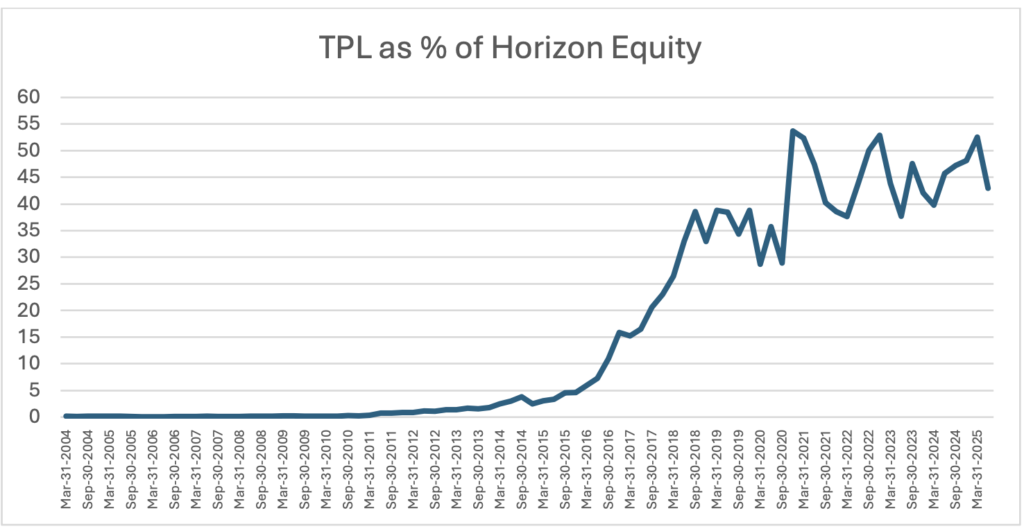
Counterargument: The report’s portrayal of Horizon’s campaign as detrimental lacks evidence of long-term shareholder value damage and misrepresents its impact. The 2021 reorganization transformed TPL from an index-ineligible trust with lifetime trustees to a corporation, enabling S&P 500 inclusion in November 2024 (GuruFocus, July 28, 2025). This increased institutional ownership (e.g., Vanguard from 0.3% to 10.7%, BlackRock to 8%, Page 14) and trading liquidity, driving the stock to ~$932 (Yahoo Finance). Horizon’s selling (20.56% to 15.60%, Fintel, July 28, 2025) just reflects risk management due to TPL’s ~40% weight in its funds (Page 14-16), not a bearish stance on TPL’s fundamentals. GCR themself details this with their graphic.
Detailed Analysis:
- Reorganization Benefits: TPL’s 2020 10-K states the reorganization aimed to enhance liquidity and attract institutional investors, achieved per CapIQ data. S&P 500 inclusion boosted TPL’s market cap to ~$21B, and governance improvements (board vs. lifetime trustees) aligned TPL with modern standards, appealing to investors.
- Horizon’s Selling Context: The report’s “30 to 1 asset-liability mismatch” exaggerates risk. TPL’s 706K daily volume supports orderly selling, and Horizon’s Paradigm Fund’s daily liquidity (Page 16) is standard for ETFs, managed via in-kind transfers or cash reserves (Morningstar ETF guidelines). Small Form 4 purchases (1-3 shares) are likely compliance-driven (e.g., director obligations), not deceptive, as 13F filings transparently show net selling. While Horizon continuously buys TPL shares, they trim their position when position increases „too fast“ due to short term price movement, endless funds trim their positions for multiple reasons Horizon just DCAs in addition to that. No information indicates that Horizon aims to exit their entire position, the graph may even lead to the opposite conclusion as the % of equity develops higher lows.
- Shareholder Value Impact: TPL’s stock outperformes the S&P 500 continuously, and no SEC investigations or lawsuits (EDGAR, July 28, 2025) suggest governance issues. Further there is no evidence that the campaign of Horizon had any negative impact on long term shareholder value.
- Motives Clarified: The report’s speculation that Horizon fostered a buying misperception lacks evidence. Horizon’s Q1 2025 commentary and 13F filings disclose its strategy, and the campaign’s focus on index eligibility was shareholder-friendly, not an “exit plan” to harm value.
- The report argues that Horizon’s selling signals weak fundamentals. However, the authors confuse short term price movement with fundamentals. Somehow GCR believes investors choose TPL because of Horizon and not the underlying fundamentals of the high margin zero debt business. Criticizing Horizon for risk management paints a picture of ignorance and lacks objective reasoning.
Evidence: TPL’s SEC filings, Fintel, and GuruFocus confirm positive outcomes from the reorganization, refuting the report’s claims of harm.
Additional Counterarguments to Report Claims
5. Valuation and NAV Estimate
Report Claim: TPL shares are worth $361-$440, based on a Net Asset Value (NAV) calculation using $2,569-$5,720 per surface acre and $28,008 per net royalty acre (NRA), implying significant overvaluation.
Counterargument: The report’s NAV estimate is overly conservative, undervaluing TPL’s unique Permian Basin assets, water infrastructure, and diversified revenue streams. The $2,569 per acre surface value (weighted average of TPL’s sales) and $28,008 per NRA fail to capture TPL’s strategic position and growth potential. Permian land values are rising, with comparables like Occidental Petroleum’s sales at $4,000-$6,000 per acre (Bloomberg, July 2025) and Landbridge’s East Stateline Ranch at $3,520 per acre. TPL’s 191,000 NRAs from 1888 generate perpetual royalties with zero carrying cost, warranting a premium. The report ignores intangible value from water infrastructure and data center contracts. With $ 741M in revenue over LTM and about 874000 acres, TPL is generating 847 Dollar per acre growing >10% as they continuously monetize their unique land assets, including the margins and the fact that there is no debt, GCRs valuation is more than wrong.
6. Declining Business Quality
Report Claim: TPL’s business is transitioning to a capital-intensive, lower-quality model with slower growth (3% revenue CAGR, 1% EPS CAGR, 2022-2024) and lower ROIC, resembling a REIT.
We won’t comment on this further as previous points already dismantled this claim, additionally the comparison to a REIT is baseless and ignores the most basic metrics (profit margins, debt, ROIC, ROCE, shares outstanding, etc.).
7. Penny Stock Characteristics
Report Claim: TPL exhibits penny stock pump-and-dump traits, citing board member Karl Kurz’s Royal Helium role and 2019 promotional activities.
Counterargument: The report’s penny stock comparison is baseless. Karl Kurz’s role at Royal Helium is not evidence of misconduct; his TPL bio focuses on credible roles at American Water Works (NYSE: AWK) and Devon Energy (NYSE: DVN). The 2019 proxy ads were standard for a shareholder vote, disclosed transparently (DEFA14A, May 8, 2019). Social media and CNBC coverage reflect TPL’s S&P 500 status, not manipulation.
Evidence: TPL’s SEC filings and lack of regulatory issues confirm transparency, refuting the report’s narrative.
Conclusion
Gotham City Research fails to understand basic metrics, the report suffers from confirmation bias and lacks objective reasoning. While claims use facts they are put into no or wrong context.
